How To Optimise Your Website’s Content
If you’re looking for new ways to improve your company’s website, but you’re not sure where to even start, using A/B testing along with Google Analytics Experiments should make it a lot clearer for you. Not only will you be able to see which content needs to be tweaked, but you’ll discover exactly which changes make the greatest impact. In this post we’ll explain how to select the most appropriate A/B tests for your company and how to set one up along with Google Analytics. We will follow this up with an article explaining the next stage of A/B testing: using Google Analytics to measure the impact of your test.
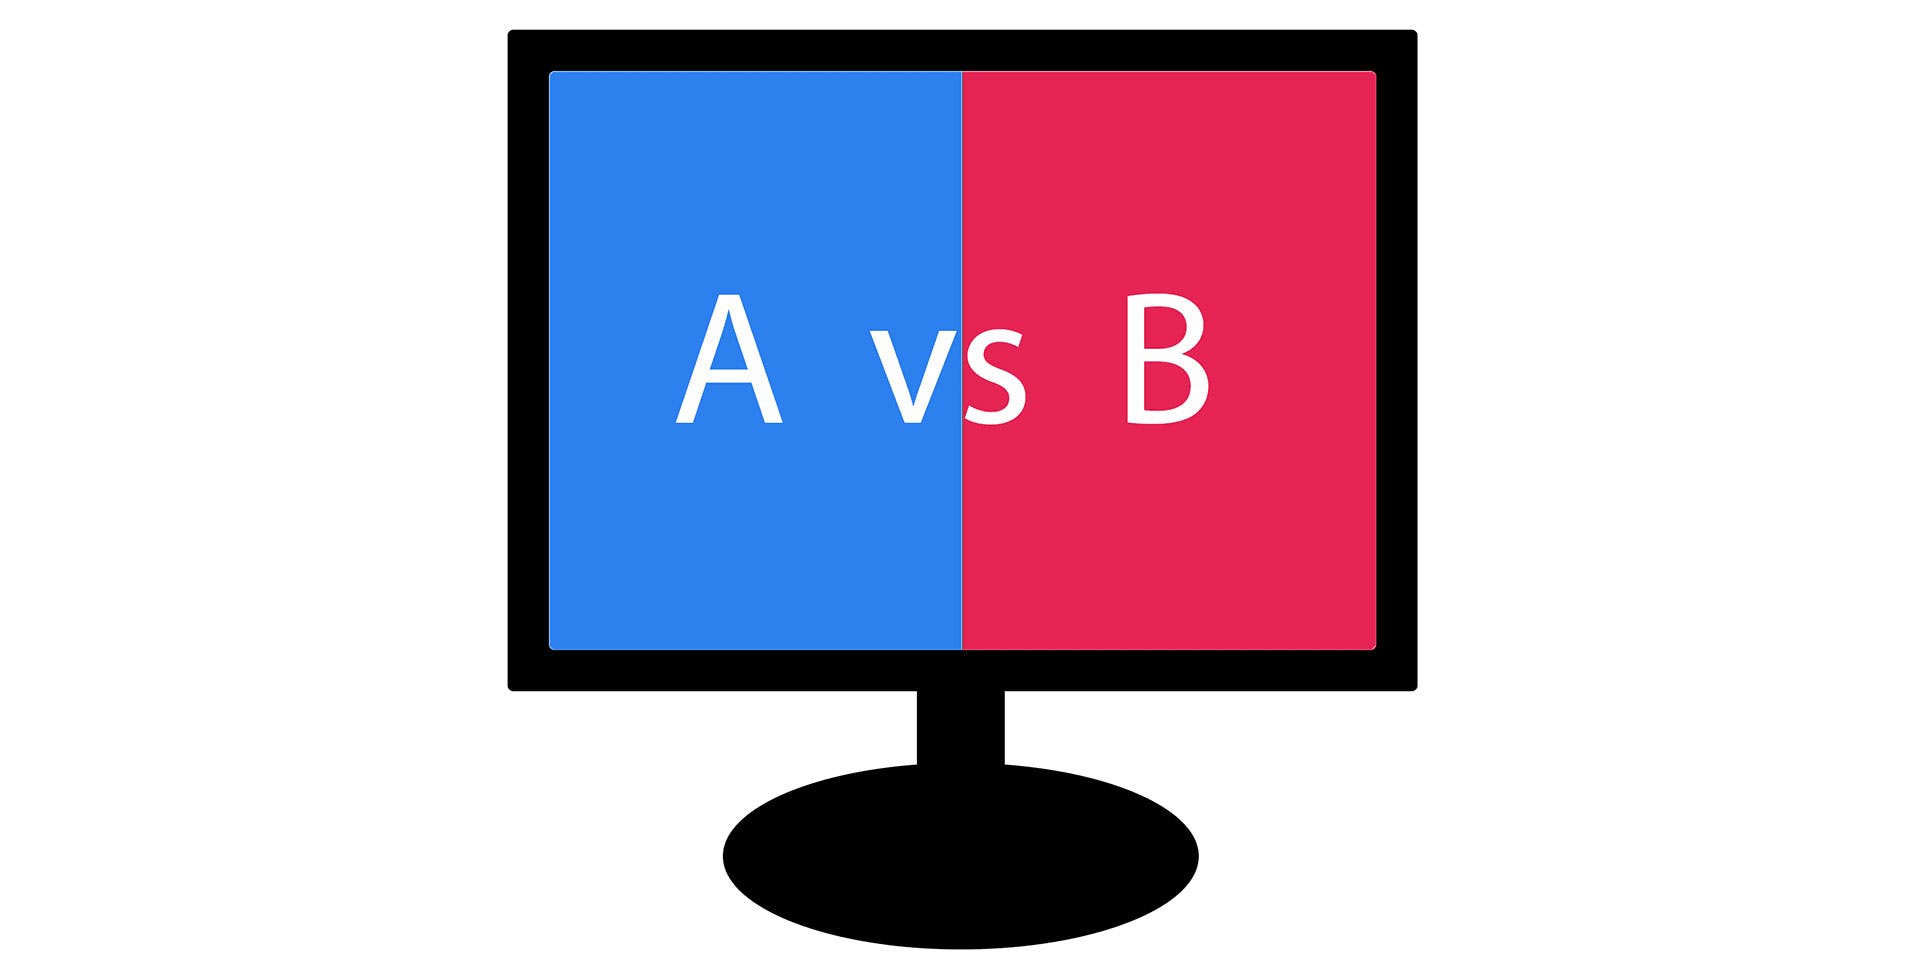
A/B testing (also known as split testing) allows you to compare two versions of a webpage to discover which delivers the best results, for ecommerce websites this is more often than not, revenue. It’s an easy experiment to conduct and will enable you to make informed decisions to help create the best possible user experience. There are many software packages, such as Optimizely, that let you run A/B tests on websites, mobile sites and apps.
How do I set up an A/B test?
In order to run appropriate tests, you should start by looking at your website’s traffic data and audience statistics. This is most easily done by investigating the data reported in Google Analytics – it’s free! The pages that have the highest impact on conversions such as the homepage and checkout pages are key areas to focus on. Look at what site visitors do when they land on your site and what they do when they get there. Below are just a few examples of things to consider within Google Analytics when A/B testing.
Use the ‘In Page Analytics’ feature of the Behaviour section of Google Analytics. This enables an overlay of “heat spots” showing which links are used more than others. For example, it might surprise you to learn that visitors to the homepage are using a footer link, rather than a banner link higher up the page to get to your most valuable page/section of the website – would reconsidering the contents and/or positioning of this banner have an impact on user experience and ultimately conversions?
Where the checkout is concerned, it is always recommended that you are able to assess each stage of the checkout first to find out which areas require attention. Create a completed checkout goal and include each stage of the checkout process a customer must go through. This will allow funnel analysis and drop-offs can be analysed. If there are a number of drop-offs at the stage where customers are expected to select delivery options then this section should be prioritised.

Once you’ve chosen the section of the website you would like to test, the next step is to decide on appropriate goals. These could include increasing ecommerce conversion rate, increasing revenue, increasing average order value, or newsletter sign-ups.
There are many different variations you can test depending on what your goals are. For example, if you’re wanting to increase the number of newsletter sign-ups, you could test different messaging, font sizes or the colour of the sign-up button. Think about which one change will make the biggest impact and focus on this. Changing a number of things will only make it harder to determine which change actually made the impact.
How do I track my A/B test using Google Analytics?
In order to track the progress of your experiment, you should set up an Experiment in Google Analytics to track your test. To do this, click the ‘Experiments’ feature of the Behaviour section. The first step involves naming your test and selecting the metric you’re wanting to improve, which could be the session duration, number of transactions or goal completions. You then need to decide on the percentage of traffic you’re going to run the experiment on. The higher the percentage is, the quicker you can get the results.

Next, you’ll need to enter the URLs for the original page and the variation page which will be part of the test. The links also have to be given names so they’re easy to identify in the report.
Content Elements will then display an HTML code that you’ll need to copy and paste into the original, and variation pages. This may be a little difficult if you’ve never used HTML, so you may want to click the option that sends the coding to your webmaster. The code will enable the tracking of all users involved in the experiment. Once the code is inserted, Content Elements runs a check to ensure the coding has been inserted correctly and that Google Analytics tracking codes are included within the pages. It will point out if there are any errors and you can follow the suggestions given for solving the problem.
Once you’ve completed each of these steps, you can choose to launch the experiment straight away if your A/B test is ready to launch,or save this for when you’re A/B test ready.
Look out for our next blog post, where we’ll explain how Google Analytics can help you measure the impact of your A/B testing. In the meantime, take a look at our top 3 tips below that should help your experiments run smoothly.
Top tips for A/B testing:
- Make sure you’re only making one change for each test so you can find out exactly which variation has made an impact on users’ behaviour.
- Don’t end your tests too quickly. Most testing tools will be able to give you an appropriate timescale depending on the sample size.
- Make sure you’re keeping a record of the tests you have run along with the results. This will help you gain an understanding of which changes have a pattern of making little difference and which changes may be worth testing on other areas of the website.
If you’re looking to improve your conversion rates, why not give us a call on 0131 668 0800.