Multi Channel Funnels in Google Analytics
Multi-Channel Funnels in Google Analytics
There have been a lot of updates recently in Google Analytics. Most useful is the introduction of various funnels and flows including Audience Visitor flow, Goal Flow and Multi Channel Funnels. In this blog we will cover one of the most important and useful elements of this update – Multi Channel Funnels including what it means in terms of improving your reporting and tracking.
The Multi Channel Funnel is interesting because it reports on and summarises your sales and conversions from the various channels you are actively implementing. This is obviously useful from an ecommerce perspective, as it helps you identify the paths and channels that work independently or together to send you sales and conversions.
The reports available are generated from conversion paths (the sequence of channel interactions that led to an actual conversion on your website). For example, the channels a customer might interact with prior to making a purchase on your website may include:
Google Organic Search > Email Newsletter > Direct Customer > Google PPC Search > Sales & Happiness
From an ecommerce perspective, this is great because it makes sense to understand and know what channels are actively working for you, encouraging customer interactions on your website and leading to sales and conversions. The Multi Channel Funnel section consists of 4 main reporting areas and these are:
- Path Length – shows the number of interactions that your visitors had with your channels, helping you determine whether specific channels or “last clicks” were responsible for conversions i.e. do customers convert on their first or third visit to your site.
- Time Lag – shows you the amount of time between customers’ first channel interaction and conversion. For example did they purchase on day 1 or take 2 or 3 days before doing so.
- Top Conversion Paths – indicates the different routes that your customers takes before completing a conversion. Conversion paths can be filtered by dimensions like keywords to see which paths and keywords work best.
- Assisted Conversion – indicates which of your specific channels, campaigns or keywords assisted each other and how they did. For example campaigns you’re implementing and how they are working together to bring you the most return.
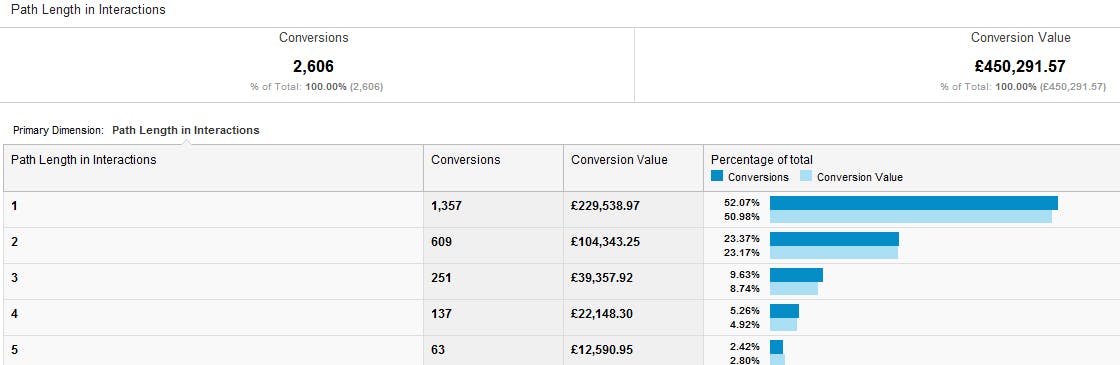
Path Length
In this example of path length below, it highlights conversations and how many visits to the site that it takes a user to actually convert. We can see that just over 50% of conversions happened with 1 interaction i.e. one visit to the website resulting in 50% of revenue for a specific time period. However, over 30actually took 2 and 3 interaction visits with the website before converting resulting in just over 30% of revenue. 30% of revenue is a lot so it makes sense to consider how we might improve on this from channel management perspective.
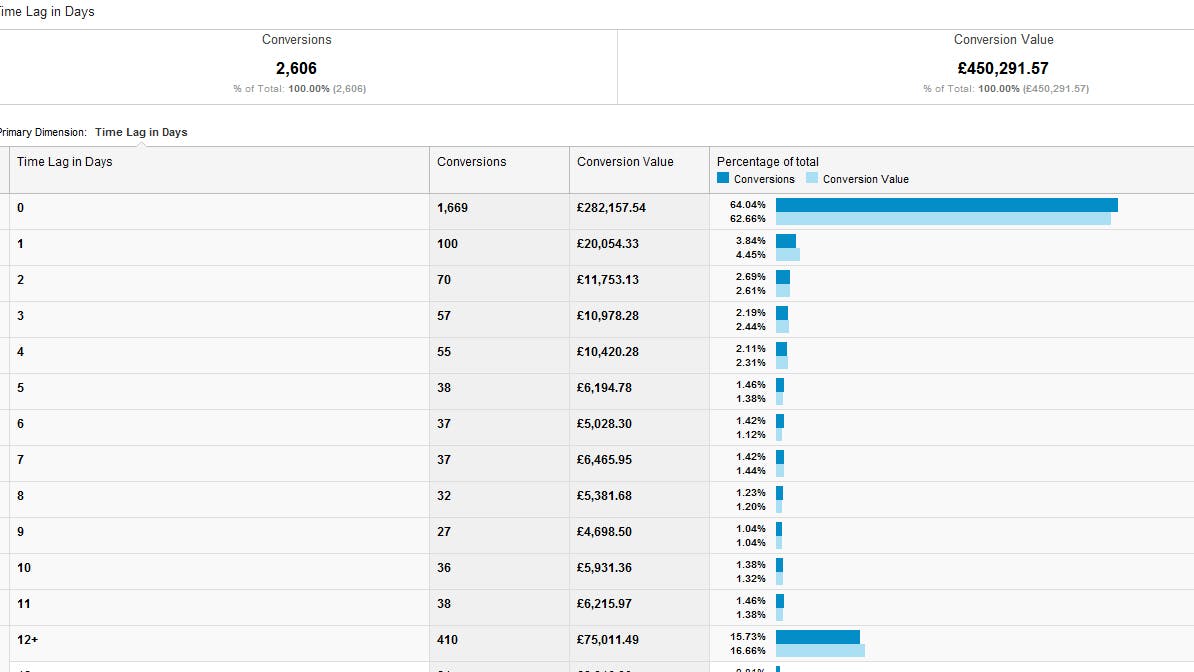
Time Lag
In the example below of Time Lag, it shows that over 64% of visitors purchased on their first visit to the website, which resulted in 62% of revenue over a given time period. Interestingly thereafter, 15% of conversions which resulted in 16% of revenue actually took 12+ days to convert. This time delay information is useful and should be considered.
Top Conversion Paths
In the example below of Top Conversion Paths, we can highlight the unique sequence of interactions that led up to conversions. Top conversation paths have an array of path dimensions to view and these include:
Source Medium Path
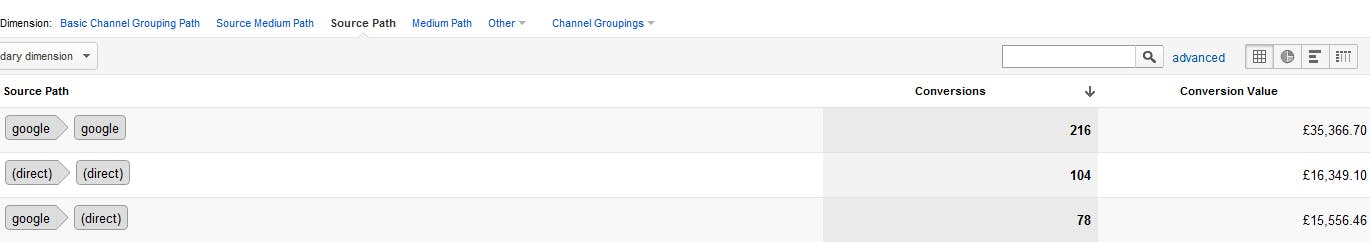
Source Path
Medium Path
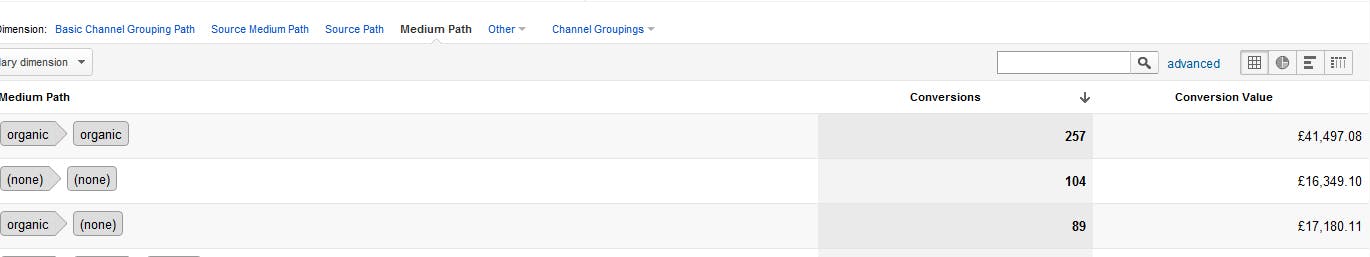
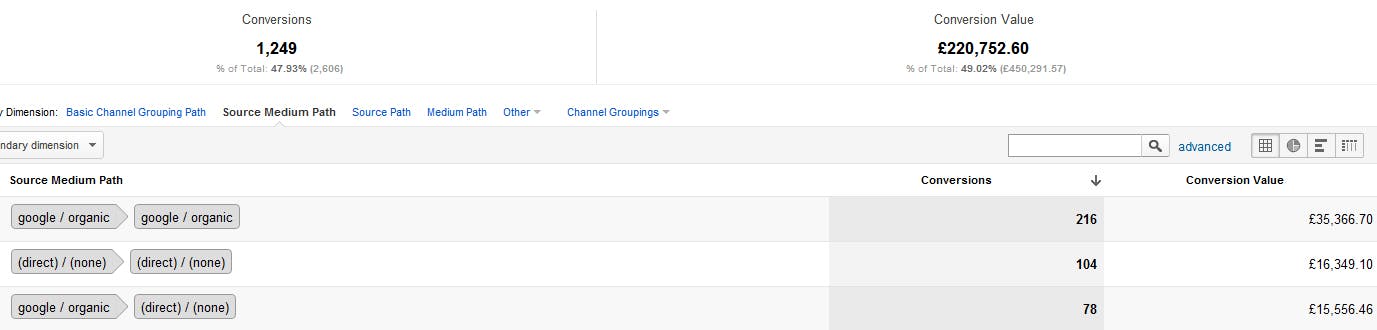
In these examples, we can see we can see that most customers conversions came from 2 organic interactions i.e. visits with Google resulting in 216 conversions. If we consider the medium path, the most some common customer conversion path was 2 interactions with organic search, accounting for 257 conversions, of which 216 came from Google. This highlights to us that organic traffic to this website is hugely important and it is a channel that must be maintained and managed at all costs .
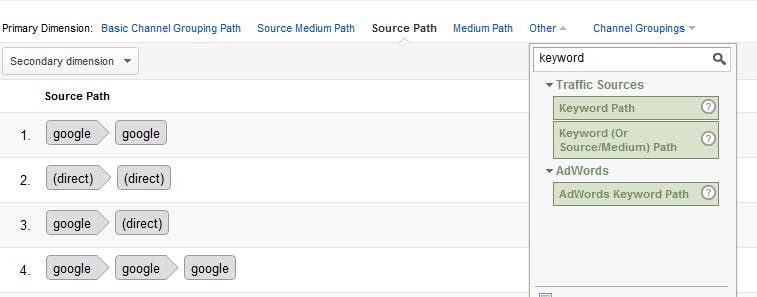
Top Conversion Paths reporting also provides the ability to identify what keywords came via what path. For example, we know that the most popular source path is Google organic search and that it takes 2 interactions with Google to get us to the website to convert. If we then filter this by Keyword (or Source/Medium) Path, we can see the keywords in this path that led to the conversions. Note, Keyword (or Source/Medium) Path is found under the “Other” Tab.
Channel grouping is also an available tab here and it allows you to be even more specific by grouping together and labelling channels that make sense for your business. For each channel grouping you can create and define a set of labels that are important. For example keyword brand searches or traffic from your social media endeavours.
For example, if we wanted to investigate our brand name Digital Six, we could create a brand search containing keywords that match the term ‘Digital Six’. Alternatively, if we were interested in finding out what interactions and conversion paths our customers took when searching using a specific keyword search terms such as ‘ecommerce, we could define this here also.
Top conversation paths is a fairly powerful report, as it provides clear insights to how your different channels are potentially interacting with each other. Understanding how your channel conversion paths and customer behaviour are working together allows you to take and make informed decisions on your campaign management.
Assisted Conversions
Last but certainly not least, we have Assisted Conversions. These reports allow us to understand the role that each channel plays in generating conversions. This is where Multi Channel Funnels can get a little complicated, but we will have a go explaining this.
- First Interaction – highlights the channels and keywords that initiate a sales cycle.
- Last Interaction – highlights the channels and keywords that tend to close a sales cycle.
- Assist Interaction – highlights the channels and keywords that our customers are interacting with during the sales cycle, prior to buying.
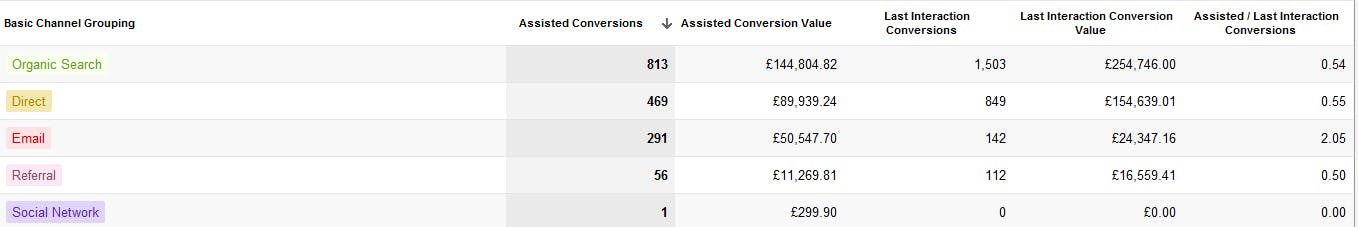
The assisted conversion report summarise the role and contribution of each channel; example Google organic channel.
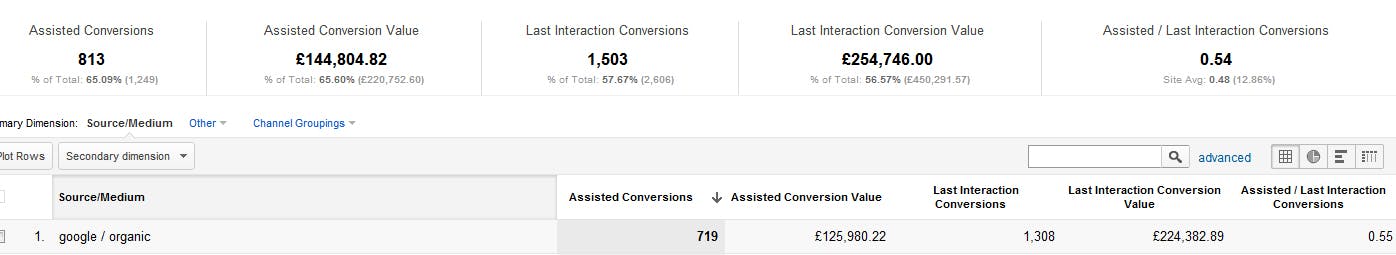
If we look at the information above and use our Google Organic Search as our Channel example we can see that:
- Assisted Conversion and Assisted Conversion Values – indicates the number and value of sales and conversations that the channel ‘assisted’ with. The higher the numbers the more important the ‘assist’ role is for this channel.
- Last Interaction Conversion and Last Interaction Conversion Value – indicates the number and value of sales and conversations that the channel ‘closed’. The higher these numbers are indicates the importance of this channel at ‘closing’ sales and encouraging conversions.
- Assisted / Last Interaction Conversion – this summarise the channels overall role in the process.
A value close to 0 – indicates that the channel ‘closed’ more sales than it assisted.
A value close to 1 – indicates that the channel equally ‘closed’ sales and ‘assisted’ them.
The more that this value exceeds 1, the more this channel ‘assisted’ sales and conversions.
Initially this reporting is rather confusing, but once you take time to evaluate your channels you begin to get a picture of the paths and channels that are working for you to increase our sales and conversions.
Within the Assisted Conversions report section, there is a link above it to a report called First Interaction Analysis. First Interaction Analysis highlights the channels that initiate conversions. For example the Google organic channel.
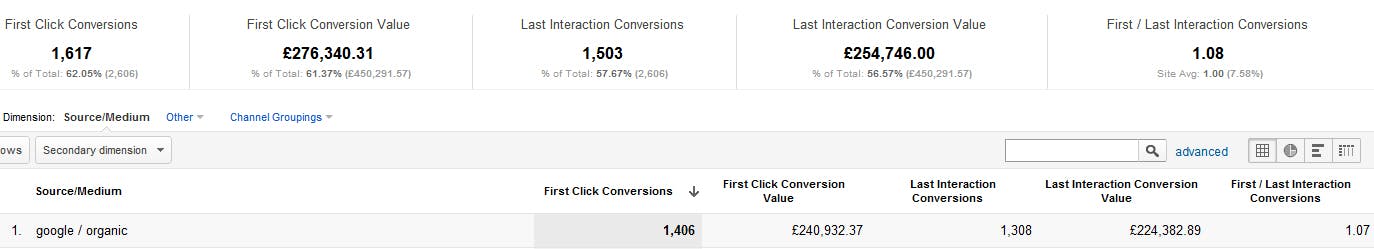
Within these reports, we are presented with the following dimensions.
- First Click Conversions & First Click Conversion Value – indicates the monetary value of sales and conversation that the ‘channel Initiated’. The higher the number is, the more important the channel’s role is in ‘initiating’ new sales and conversions.
- Last Interaction Conversions and Last Interaction Conversion Value – indicates the number and monetary value of sales and conversions that that the channel ‘closed’. The higher the number is the more important the channel’s role is in ‘closing’ sales and conversions.
- First / Last Interaction Conversions summarises the channel’s overall role in the process
A value close to 0 – indicates the channel ‘closed’ more sales than it ‘initiated’.
A value close to 1 – indicates the channel ‘equally initiated’ and ‘closed’ sales.
The more that this value exceeds 1, the more this channel ‘initiated’ sales and conversions.
In this final example below, we can see that Email Marketing has an Assisted / Last Interaction Conversion of 2.05 which indicates that Email Marketing is a channel that initiates sales and conversions. This would be one channel to really push to maximise its’ potential, as we now know that this is a channel path that is really working for this website to achieve sales and conversions.
So, there we have it, Multi-Channel Funnels in Google Analytics. We think this is a really useful reporting tool in Google Analytics especially for ecommerce websites. It does help us to manage our online campaigns more effectively by indicating and identifying the different marketing channels we use to their full potential. All in all a good tool albeit, a little complicated to understand to begin with. It takes a few plays to get the hang of Multi Channel Funnels but when you do, you will see the benefits.