Google Analytics for eCommerce: Five Common Analytics Pitfalls

While it might seem straightforward once you’ve got a basic working knowledge, Google Analytics is actually a very complex platform. We work with ecommerce businesses big and small, day-in and day-out, and there’s rarely a day that goes by that we don’t encounter a stakeholder who has the wrong end of the stick when it comes to interpreting Google Analytics data.
There are any number of articles out there that will explain the basics of how to understand Google Analytics, but in this blog post, we wanted to dive into a few of the common pitfalls that we see when it comes to interpreting GA data.
Why it’s important to get to grips with Google Analytics
Web analytics platforms can provide you with key information about how your business is performing. A well set-up and interpreted analytics account will tell you what’s working well and where to make improvements, where to invest and where to cut out wasted spend.
But they’re only as good as the quality of the data and the depth of your understanding. There are some platform quirks and often-missed fundamental truths that (if not understood properly) could lead to you making some bad business decisions.
Who is this article for?
For many businesses, Google Analytics is their go-to source of data for revenue and profitability tracking. The data it provides is likely to be hugely important to your working life if you are, perhaps…
- A small to medium (SME) business owner or MD
- An ecommerce manager
- A C-Suite stakeholder (like a CFO)
Maybe you use Google Analytics directly – or you’re provided with reports which reference it – ultimately, you’ve got a desire to understand how your online retail business is performing. You don’t have the time to become a trained data scientist, and that’s ok. If you’re aware of these common pitfalls, and our helpful tips to navigating them, you’ll be making big strides in the right direction.
eCommerce Analytics Pitfall 1: Taking the numbers too literally
Firstly, it’s important to realise that GA takes hugely complex data sets and aims to provide useful insights that are easily digestible by the average user. The story is, unfortunately, rarely as black-and-white as it might seem, and there are some fairly risky analytics traps waiting to mislead the casual user.
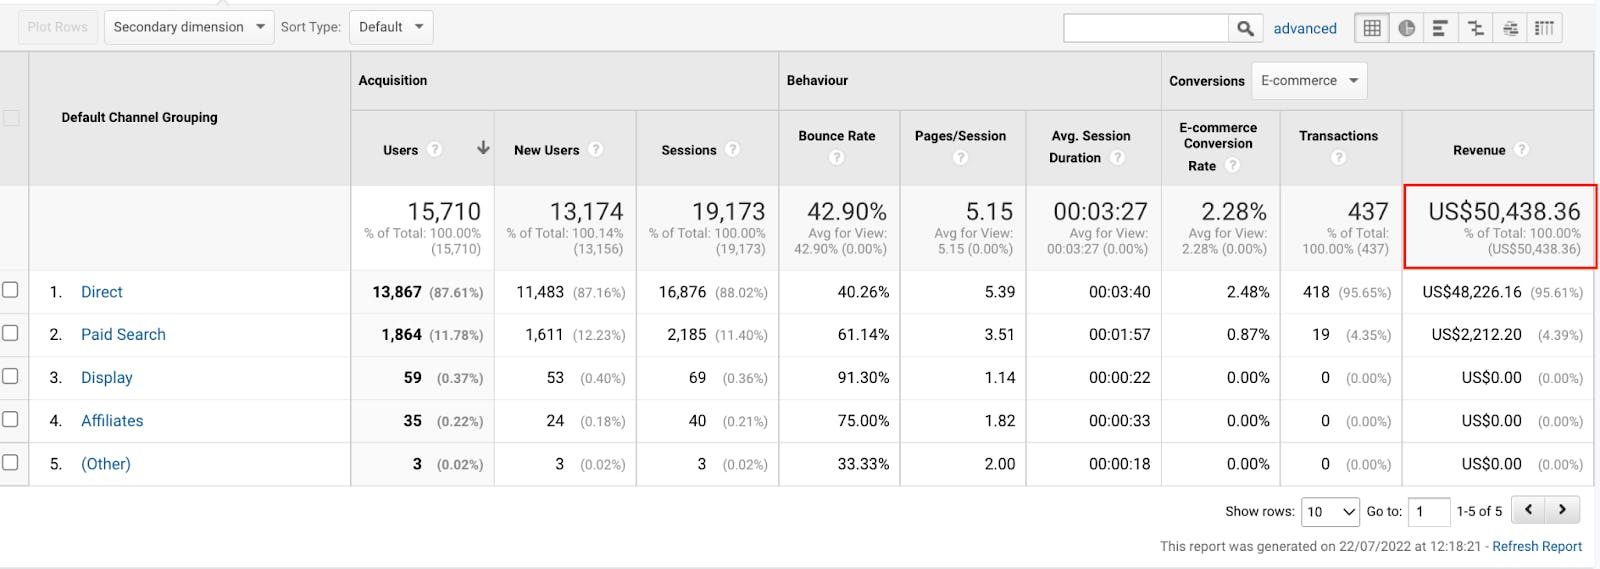
The standard acquisition-by-channel view in Google Analytics is one we’re probably all familiar with. It’s a go-to for many of us when we want to understand how to see where traffic is coming from in Google Analytics.
It shows each of the default channel groupings – Organic, Paid, Social etc. – with information about the volume of users, quality of traffic and, ultimately, revenue that has resulted from activity in that channel.
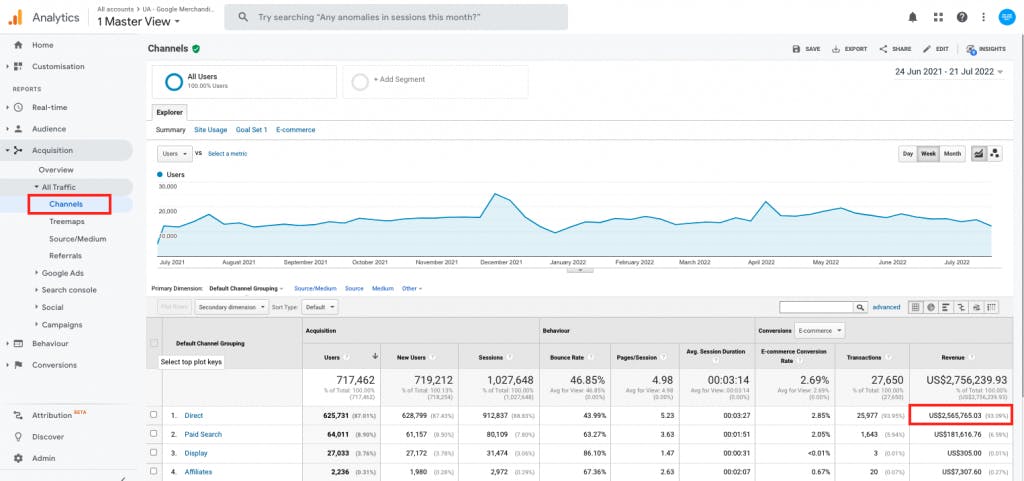
And here’s where we run into our first issue – those revenue figures. It’s all too easy to look at those, believe them, trust them, and take them at face value. But, how accurate is Google Analytics when it comes to reporting revenue by channel? The truth is that it’s not as simple as it might seem.
Avoid the pitfall: Get to know Attribution Modelling
Have you ever asked yourself “How does Google Analytics attribute conversions?”. Attribution Modelling is an attempt to assign value to each touchpoint in the complex journey a user takes to become a customer.
With a vast number of potential channels and touchpoints, multiple devices, and cookie control thrown into the mix, it’s far from straightforward. Attribution Modelling is by definition an incredibly complex and imperfect science.
The standard Google Analytics Acquisition-by-Channel view is based on the Last Non-Direct Click model. So it assigns 100% of the value to the last thing someone did in a given time frame, excluding if that was a “Direct visit” (I’ll explain why “Direct visit” is in inverted commas later). Doesn’t sound very scientific, does it?! And it doesn’t help us to understand the value of any interaction that the customer had earlier on in their buying journey either.

In certain businesses, with certain product types, the Last Non-Direct Click model might be a pretty good yardstick. Unfortunately, it can quickly lead to businesses heavily favouring end-funnel tactics, which can be short-sighted and ultimately costly in the long run.
Ultimately, you need to get to know Attribution Modelling and understand the differences between the various models. Using the Model Comparison Tool within Google Analytics, you can test the various different models and understand what they do to the revenue figures attributed to each channel. It’s likely that you’ll see fairly massive swings in revenue from one model to the next, and it’ll give you an understanding of the different ways you can look at that total revenue figure and how it relates to channel performance.
All of the numbers are wrong in one way or another. Even the more recently favoured Data-Driven models are influenced by the algorithm that drives them. Ask yourself, who wrote that algorithm, and what is their agenda?
It’s important to choose one or more attribution models which best help you to understand the impact that your channel activity is having. There’s little point in assigning value to channels you can’t do anything about either, so choose models that flatter the work you’re doing – go ahead, you deserve it!
Avoid the pitfall: Factor-in the impact of data privacy laws
You might also have asked yourself why Google Analytics is not accurate when it comes to your total revenue figure. Why is there a difference between what Analytics reports, and what comes through the till?
Well, the other thing to mention here is that, since the introduction of cookie control, there’s likely to be a proportion of revenue which Google Analytics doesn’t record at all, because the user opted-out of analytics cookies.
It’s important to understand this gap, and create working models that assign additional value to the channels you’re active in, in order to account for it.
eCommerce Analytics Pitfall 2: Taking the Direct channel at face value
There’s a common misconception that this channel purely represents customers coming straight to your website, just typing in the URL and – boom – they’re there and they’re buying.
The direct channel invariably seems to show a lot of revenue too – happy days! Large chunks of revenue that just fall into our lap. Let’s just sit back and relax, right? Wrong. For two reasons.
The first problem with direct channel data
The direct channel does include a certain amount of traffic coming straight to your website from a customer typing in the URL. However, it also tends to be a dumping ground for all sorts of other traffic that Google can’t classify. But why does it happen?
There’s a whole host of reasons. Most likely (and very commonly) the connection between ad channel and analytics, or between referrer and analytics, can be lost. Usually information on the source of the traffic is passed over but, in some cases, it’s not – or it’s not done cleanly.
The ongoing crackdown on third-party cookies means this is only happening more frequently. At Digital Six, we commonly see huge proportional increases in direct traffic year-on-year, while revenue that’s directly attributable to advertising is often shrinking.
The second problem with direct channel data
Even if a bunch of revenue is seemingly just falling into your lap, it had to have come from somewhere. Perhaps it’s a returning customer that loves the great service you provide, or it’s a new customer who’s heard about that great service by word of mouth.
Or perhaps because indirectly someone scrolled past a load of your social content without clicking; they watched some of your informational video content on YouTube; months ago they clicked on a search ad and are only now coming back to make the purchase; they’ve completed most of the consideration phase on one device and returned to transact on another.
Many of these factors aren’t easy to account for, so it’s difficult to quantify a solid return-on-investment figure. But there is an easy solution…
Avoid the pitfall: Give your channel activity credit for a proportion of that Direct revenue
You have to have a certain amount of faith in the work that you’re doing. If you’ve gone through a proper process to create a strong digital marketing strategy, your activity has a sound theoretical base, and you’ve invested appropriately in it, then believe that it’s ultimately influencing the revenue you see landing here, in the Direct channel. The worst thing you can do is believe that all this Direct revenue appears by magic and that you don’t have to invest or work for it.
Consider building a model which assigns some of this Direct revenue, proportionally, to the channels in which you’re active. If this is enough to give you the confidence to invest more confidently in your marketing activity, it’s good news, and avoids the risk of under-investment.
eCommerce Analytics Pitfall 3: Misreading Organic channel data
There is a big difference in intent between a user searching for your own brand term, a user searching for a commercial product or service, and a user looking for informational content. Each of these search types reflects a very different stage in the user’s journey.
When these searches take place in search engines, like Google or Bing, and a customer doesn’t click on a paid ad, Analytics automatically assigns this traffic to the Organic channel. But why is that an issue?
The issue arises from that key difference between brand and non-brand search.
We commonly come across brands that have a large proportion of their organic traffic originating from searches for their own brand terms. It’s technically Organic traffic (because it came organically from a search engine) but in reality it’s more akin to direct traffic.
It’s important to understand how much of that organic revenue is coming from non-brand traffic (i.e. your well-optimised category pages and blogs, for example) and how much is coming from brand awareness (i.e. repeat customers, word of mouth, or as a result of less direct brand awareness activity you’re carrying out).
Avoid the pitfall: Understand branded organic search term performance
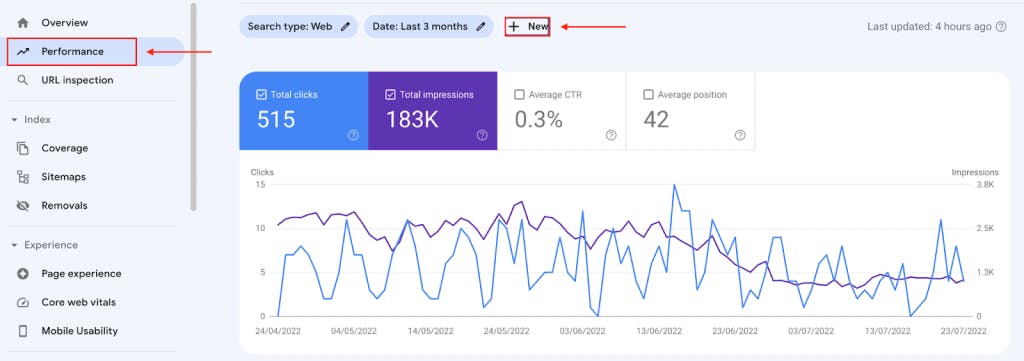
A good digital marketing agency, or SEO consultant, is the best route to properly understanding what the Organic channel is really saying. However, it is possible to get some quick insight from Google Search Console (GSC).
The Search Queries report in Search Console can give you an idea about the proportion of Organic traffic that’s coming to your site as a result of branded searches, versus non-branded searches. While it’s a pretty rough indicator, it can start to give you some insight into what proportion of the revenue assigned to that channel comes from your site optimisation and content, and what proportion comes as a result of brand awareness.
Here’s how…
💡Tip: Keep in mind that even GSC data is not perfect, and it only provides terms used in Google’s search engine.
1. Navigate to your Google Search Console property (learn how to set GSC up here)
2. Head to the “Performance” tab (set the date range to the longest possible period)
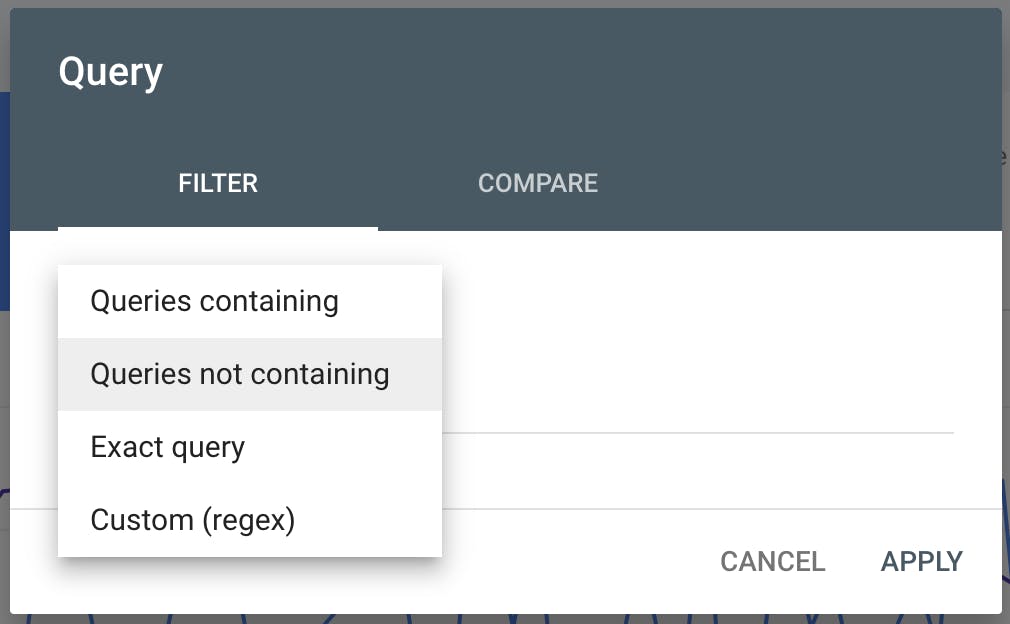
3. Click “+ New” to add a new filter
4. Add a filter for “Queries not containing” your brand name
5. Take the total clicks for these non-brand searches as a proportion of the total clicks
Non-brand % = (Non-brand clicks / Total clicks) * 100
So, if your business received 1933 clicks from Google organic web search in the past 3 months, and 1342 searches included your brand name then (1342 * 100 / 1933 = 69.43%) nearly 70% of the organic channel traffic is, in many ways, just direct traffic in disguise.
It’s a quick and dirty way to start to understand how much of that organic traffic and revenue is coming from your good SEO work, and what proportion is more likely a result of brand awareness, word of mouth, and potentially a combination of every other marketing channel.
Getting a clear picture of actual organic performance is far more complex than just filtering out brand terms from your GSC account overview. That said, looking beyond Organic channel reports in Google Analytics is a crucial step to learning more about the true picture of how your site is performing.

eCommerce Analytics Pitfall 4: Believing that traffic without directly-attributable revenue is not valuable
To follow on from our previous points, you’re probably getting the understanding by now that most face-value data within Google Analytics (and certainly that acquisition-by-channel view) has to be taken with a pinch of salt. There’s a huge amount of noise in the data. Attribution is imperfect, and for most small to medium businesses without the volume of customers or deep pockets to necessarily invest in advanced attribution and data modelling tools, the situation won’t get any better any time soon.
So… what to do? Kick back with the feet up on the desk? Sit on our hands? It’s a risky approach to be sure. Better to think back to what life was like for many of us before the advent of digital, where we had to make a lot of decisions based on a strong strategic framework and a healthy dose of gut feel. We’ve got to invest, to a degree, where it feels right – and look for the signs that we can see, to help us understand what’s valuable and what’s not. This approach is known as Holistic Marketing – a belief that everything is connected and it all counts.
One of the common pitfalls that we see, is where stakeholders look at analytics data, they see campaigns or channels which seemingly produce little to no revenue, when viewed in these standard reports. They’ll look at traffic coming from Social or from certain campaigns in Paid, and if there’s no revenue attributed directly in that standard Last Non-Direct Click view, they’ll pull the activity.
Meanwhile, they’ll be seeing huge year-on-year increases in Direct and branded Organic revenue. And if you look closer at the data, beyond the revenue column, you’ll see a high quality of traffic coming from these “underperforming” channels – low bounce rates, high pages/session, long dwell times.
Avoid the pitfall: Pay attention to quality of traffic
In the absence of directly attributable revenue – quality of traffic is a very strong indicator of success in our view. Given what we know about the wooliness of attribution when it comes to Google Analytics for eCommerce, it’s far more likely that quality traffic is contributing to the wider success of the business, than that it’s worthless.
If you can be sure that the traffic a campaign has generated has come from relevant searches, from targeted audiences, it’s not bouncing, it’s spending a lot of time on site, looking at several pages, that’s good quality traffic. Chances are, this traffic is having an influence on the revenue attributed to other channels.
And if it’s not – if that quality of traffic truly isn’t converting – then you need to be looking into reasons why that might be. Conversion Rate Optimisation, pricing, stock availability, service. A lack of attributable conversions is not always the fault of the campaign that generated the traffic. It can point to wider issues in your site, product offering or business.

eCommerce Analytics Pitfall 5: Still only looking at Universal Analytics
Our final word of warning is for those of you who are still only working with GA3 / Universal Analytics data. As of July 2023, Universal Analytics will cease to be, and will be replaced by GA4. If you haven’t already, you should be implementing GA4 with the full suite of ecommerce events and datapoints.
Avoid the pitfall: Get to know GA4
GA4 is quite a different beast – it is very much not business-as-usual. This coming year is your opportunity to, as Google puts it, “understand the differences”. Not to aim for consistency with what you’ve had up until now, but to get used to what the new normal looks like.
Many of the common features, functions, reports and metrics that you’re used to will no longer exist, or not come as standard. And, of course, there’ll be lots of new and interesting features and benefits to get your head around.
The key is not to leave it to the last minute to start understanding what’s coming – particularly if it’s your job to manage other stakeholders and their understanding of the data the system provides.
In many ways, it presents an opportunity. As we’ve discussed, common misconceptions abound around Universal Analytics and the data it provides. A move to a new system provides the opportunity to engage with stakeholders on exactly these misconceptions, so that you can move forward with a better shared understanding of exactly what you’re looking at.
The roundup…
In summary, if you can take a few points away from this article to help your understanding of how to interpret Google Analytics for eCommerce, it would be these…
- Don’t take your Analytics data at face value – question it, and look a little deeper.
- Get to know Attribution Modelling and the impact it has on reported revenue.
- Don’t be drawn into the trap of under-investment, by being complacent about large proportions of Direct or Branded Organic revenue.
- Get started with GA4 sooner rather than later.
If all this sounds like a confusing picture or you need help to get your head around it, remember, we’re always here to help. Get in touch today.